


Seeing More in a Single Day: The Value of Intraday Satellite Collections
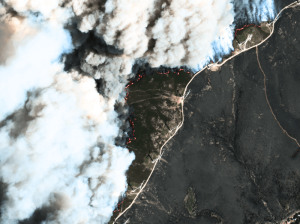
Imagine a convoy moves between 08:00 and 11:00. Or morning clouds clear by 14:00, revealing new activity. Or a structure appears at 09:30 that wasn’t visible at 07:00. If you’re working with once-daily satellite passes, you miss all of this. With intraday collections, you see it happen.

GEOSeries: Maintaining Temporal Control of Developing Situations With Rapid Satellite Tasking and Intraday Imaging
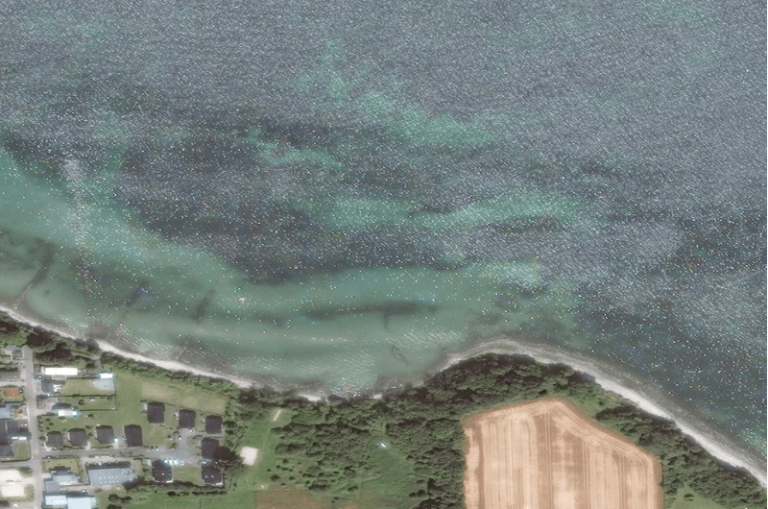
In the fast-moving operational environments of security monitoring and emergency response, the value of satellite data is defined by when it arrives, not just its resolution or accuracy. This webinar explores how Dynamic Tasking enables users to access actionable data fast and operate within mission decision windows.
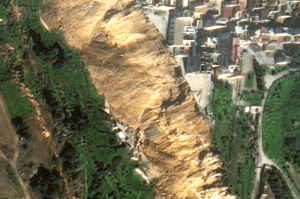
VHR Satellite Images Show Damage After Niscemi Landslide
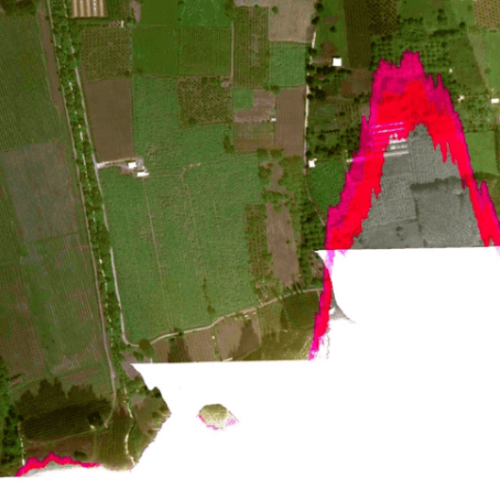
In January 2026, Italy declared state of emergency after being hit by Cyclone Harry – a storm that brought 10-metre waves and torrential rains of over 300 mm in 48 hours. The most severely affected regions were Sicily, Calabria and Sardinia, with the damage in Sicily alone estimated to be more than 1.5 billion euros. EUSI collected Very High Resolution satellite imagery of the affected areas, including Niscemi – a Sicilian town hit by a massive landslide.
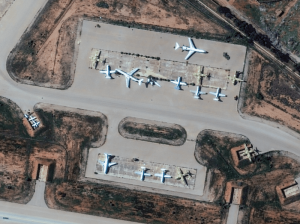
The Potential of WorldView Legion for the Safety and Security in Europe
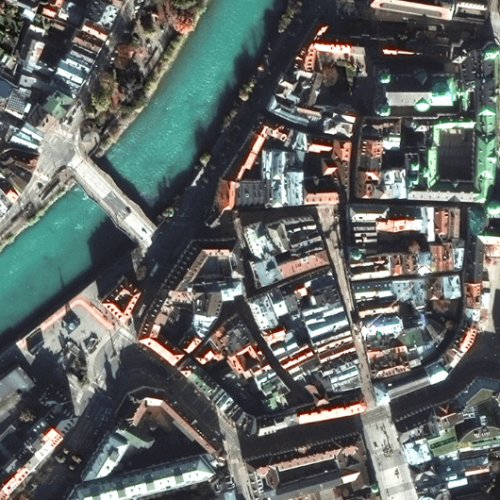
In the ever-evolving landscape of global security, satellite imagery has become an indispensable tool for governments, organisations, and businesses worldwide. Many of them are now learning about the new opportunities that the six recently launched Vantor WorldView Legion satellites bring: higher border security, improved maritime surveillance, faster reaction to developing events, and much more.