VHR Satellite Images Show Damage After Niscemi Landslide
- Zuzana Hajkova, Content Marketing Coordinator, EUSI
In January 2026, Italy declared a state of emergency after being hit by Cyclone Harry – a storm that brought 10-metre waves and torrential rains of over 300 mm in 48 hours. The most severely affected regions were Sicily, Calabria and Sardinia, with the damage in Sicily alone estimated to be more than 1.5 billion euros. EUSI collected Very High Resolution satellite imagery of the affected areas, including Niscemi – a Sicilian town hit by a massive landslide.
© OpenStreepMap contributors © Esri
Landslide in Niscemi
In January 2026, a massive landslide surprised everyone in Niscemi, a Sicilian town of 25,000 inhabitants. The landslide initially damaged only a road connecting Niscemi to the Gela-Catania state road, but continued to widen in the following days, until a 4-kilometre stretch of hillside collapsed. The disaster, caused by harsh weather conditions, led to the evacuation of 1,500 people and significant damage to buildings and infrastructure.
Satellite images of the Niscemi landslide
Initially, because of the relentless rain, the area was cloudy and satellite imagery couldn’t be collected. Later, clouds started clearing and EUSI collected three very high resolution images:
- 24 January: 60 cm resolution, 51% cloud cover, collected with the WorldView Legion satellite
- 27 January: 60 cm resolution, 12% cloud cover, collected with the WorldView Legion satellite
- 2 February: 50 cm resolution, 0% cloud cover, collected with the WorldView-2 satellite
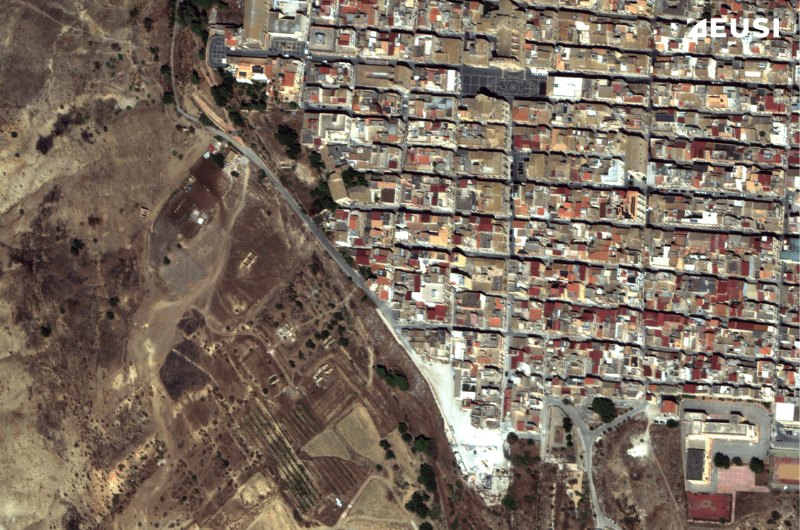
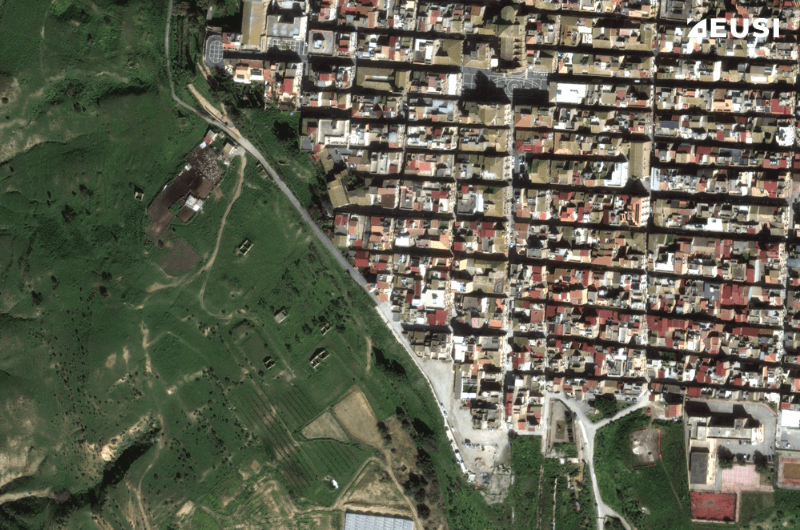
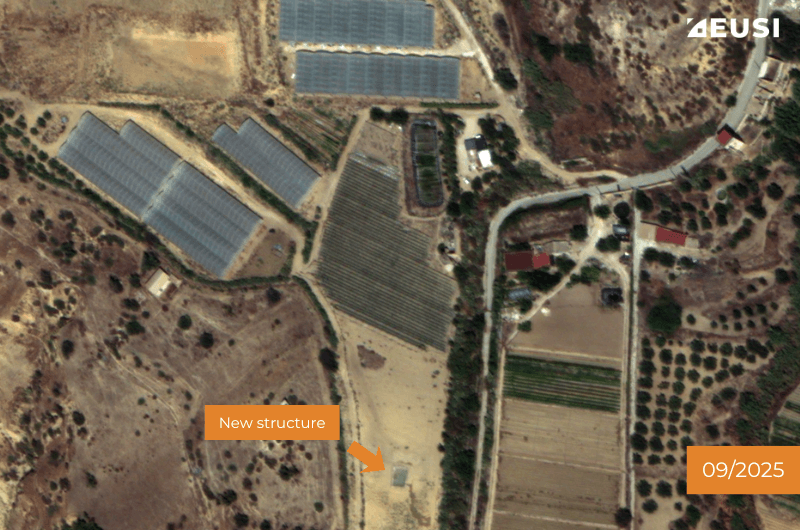
We produced these three images to analyse the landslide damage, together with two archive images to compare before & after the landslide. One of the selected archive images is from September 2025 – the newest imagery of the area before the landslide happened. The second archive image is from February 2026 and was selected to show the area within the same vegetation season.

Before and after comparison using the most recent image of the area (September 2025). Satellite imagery © 2026 Vantor Provided by European Space Imaging

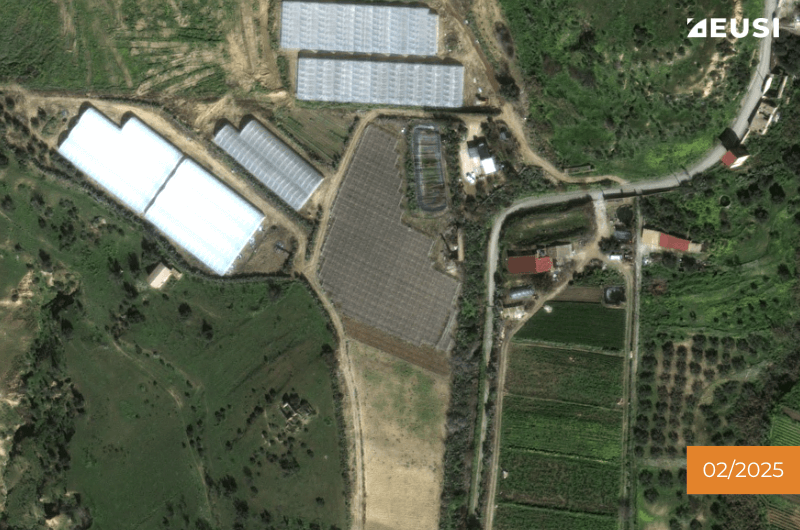
Before and after comparison using an image from the same vegetation season (February 2025). Satellite imagery © 2026 Vantor Provided by European Space Imaging
Damage analysis
A wider area view shows the 4 km long hillside that collapsed, with two distinct slip surfaces visible (annotated as Rupture 1 and Rupture 2). The upper rupture marks the initial detachment of the slope, while the secondary scrap likely formed as a result of the first scrap, and created a roughly parallel rupture line.
Please note that the analysis was carried out by EUSI and is not confirmed by emergency response organisations. Satellite imagery © 2026 Vantor Provided by European Space Imaging
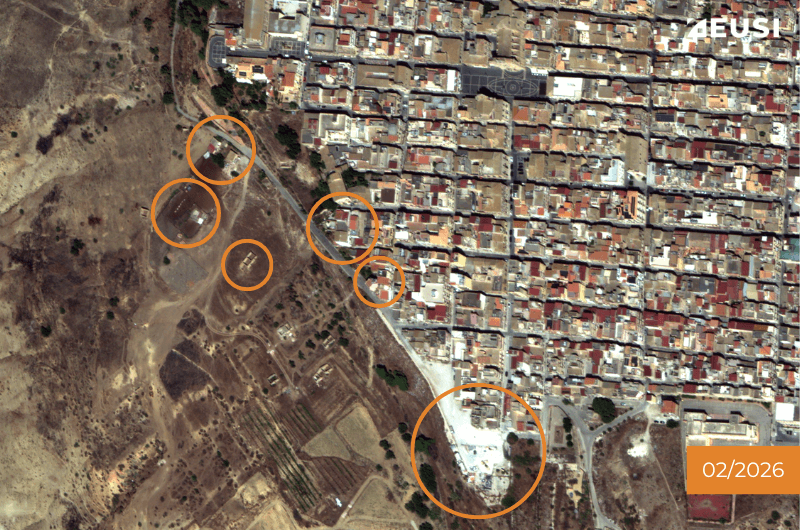
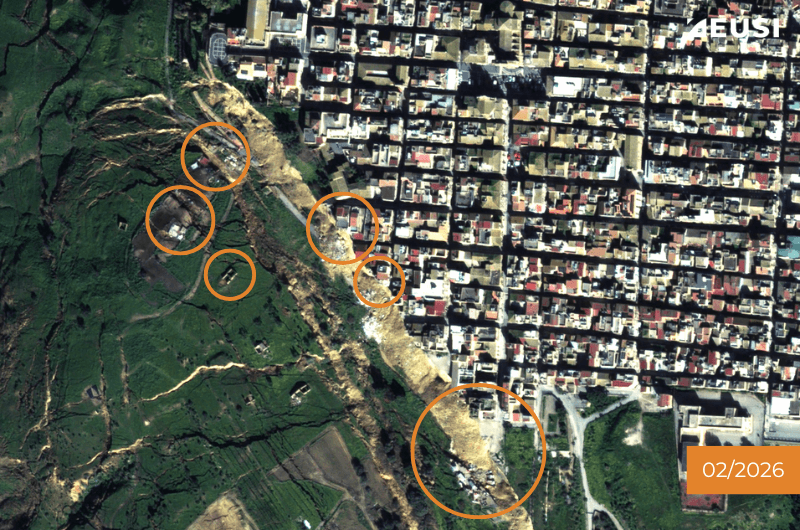
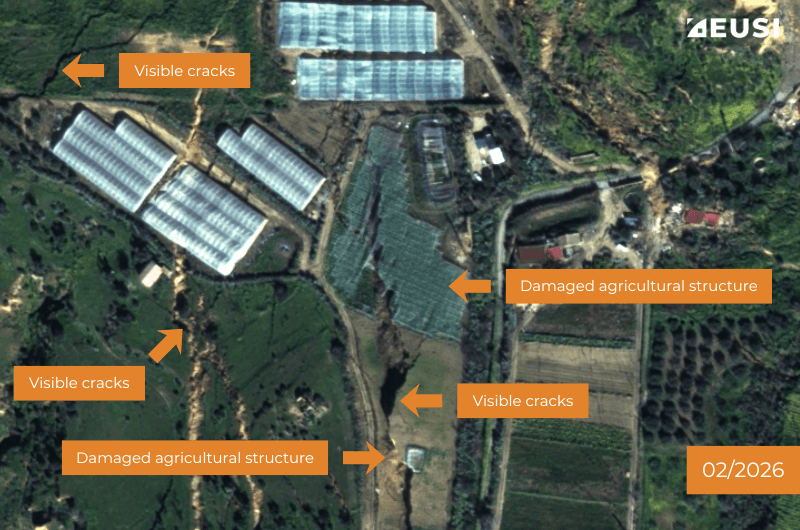
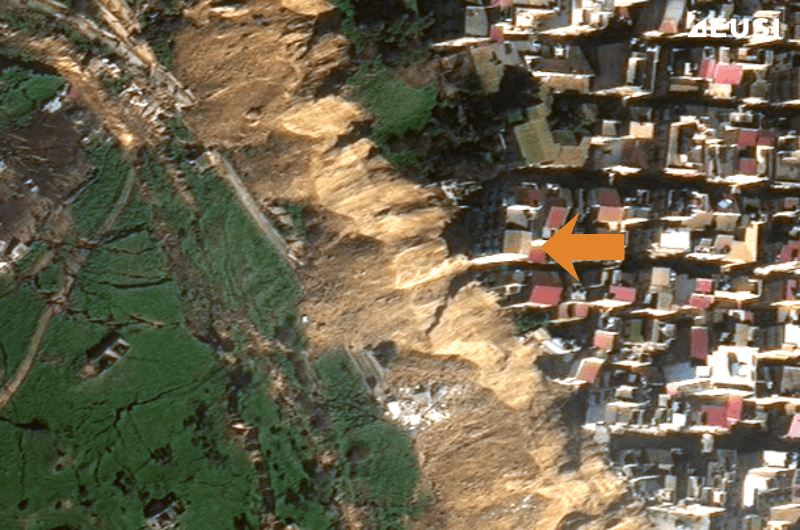
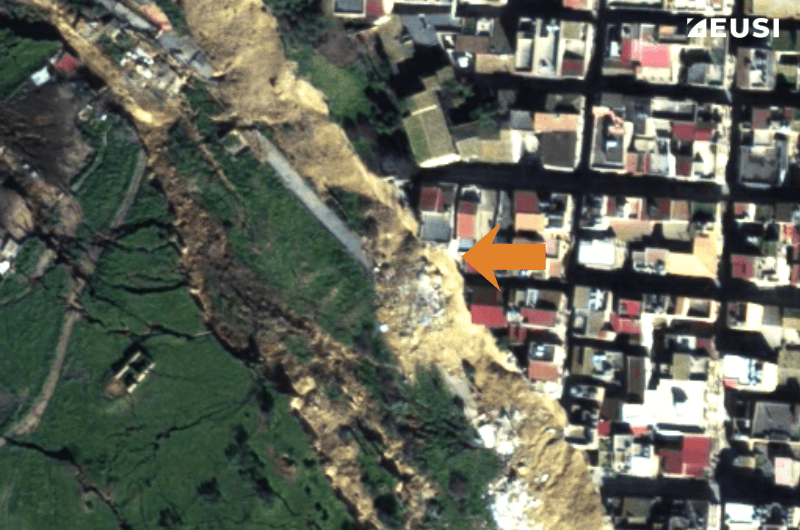
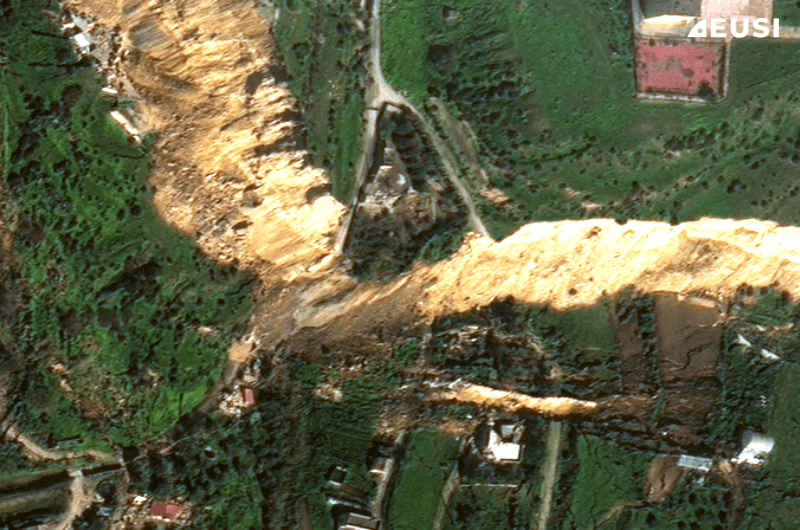
Destroyed houses and roads, large areas of broken ground, and disturbed vegetation can be seen at the base of the newly formed cliff. Examples are highlighted in the before & after images below:


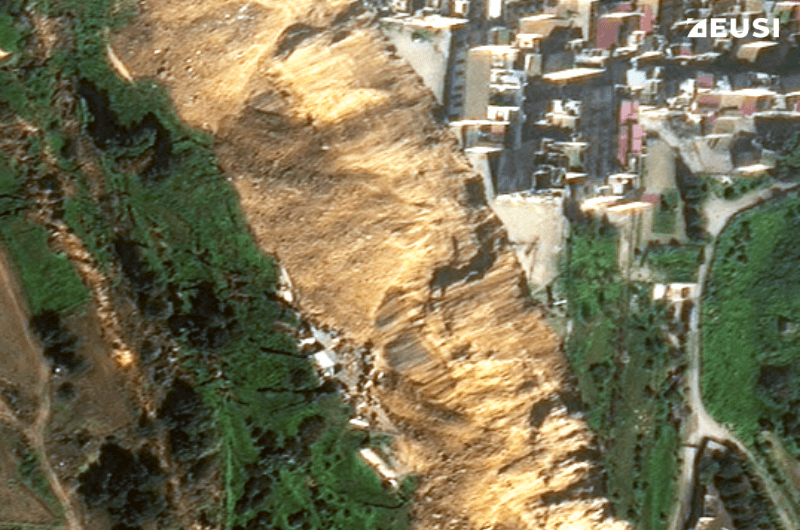
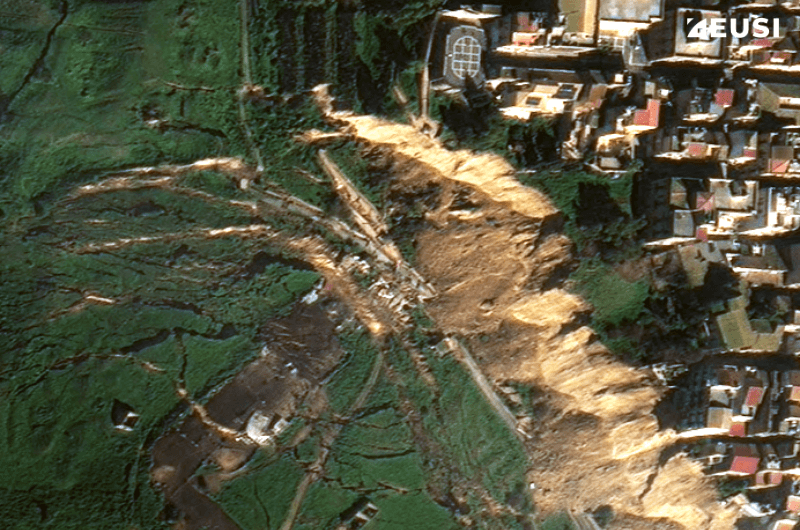
The VHR satellite images show the extent of damage in detail:


Progress of the active landslide through time
Because the satellite images were collected on different days of the active landslide, we can compare them and see how the disaster developed. For example in the images below, you can see the collapse of a building between 27 January 11:24 CET (first image) and 2 February 10:41 CET (second image):


Off Nadir Angle Matters
The images were collected not only on different days, but also at different off nadir angles. That provides a different perspective and allows emergency responders better understand what exactly happened.
Satellite imagery © 2026 Vantor Provided by European Space Imaging
30–60 cm detail
VHR stands for Very High Resolution and is used for satellite imagery at a resolution of 1 metre or better. EUSI images at very high resolution show details of the damage:
NDVI landslide analysis
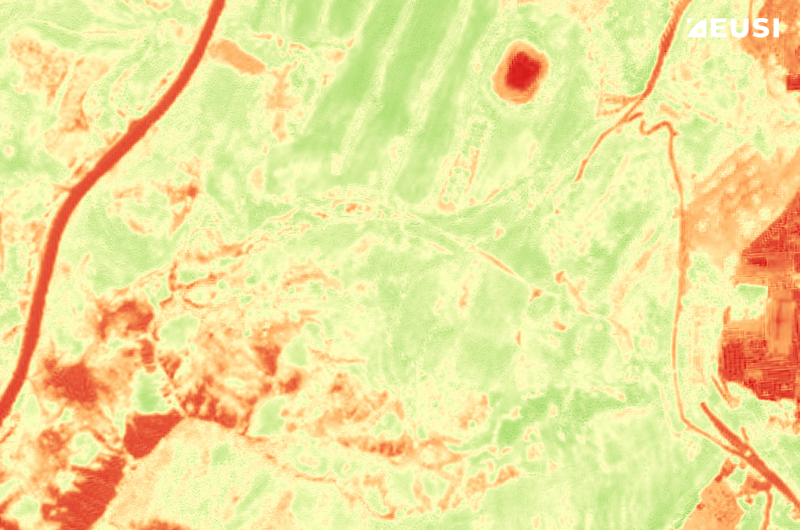
The analysis of satellite imagery goes beyond what we can see with our own eyes – EUSI images can be produced with up to 8 multispectral or 8 SWIR bands. We produced them as 4-band data and used the Near Infrared band to calculate NDVI, an index which, in this case, shows the impact of the landslide on vegetation and soil. An analysis like this can help with reconstruction and the prevention of further damage.

Before and after comparison using NDVI. Satellite imagery © 2026 Vantor Provided by European Space Imaging
Predicting the future
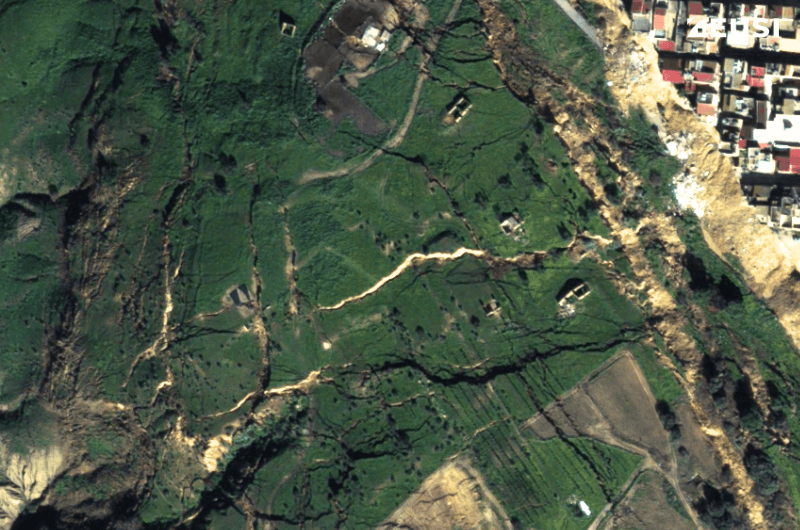
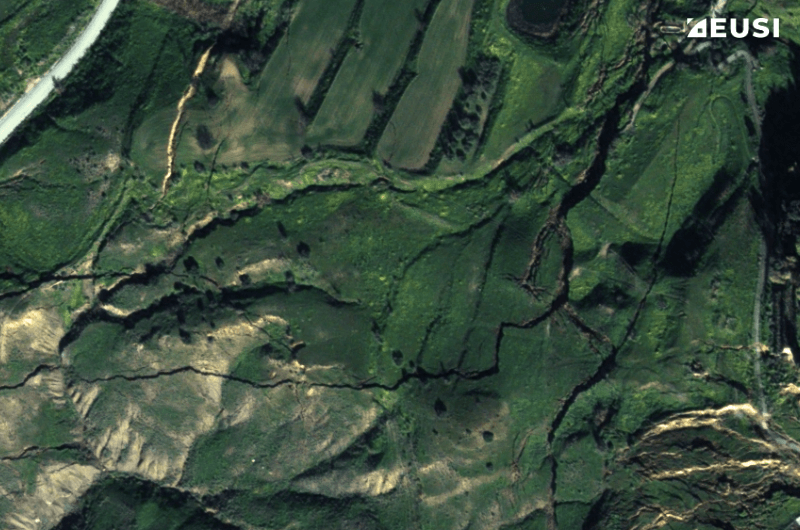
Emergency responders use satellite images not only for evaluating damage but also for prediction and prevention. In the instance of the Niscemi landslide, we can see two main indicators of the instability of the area:
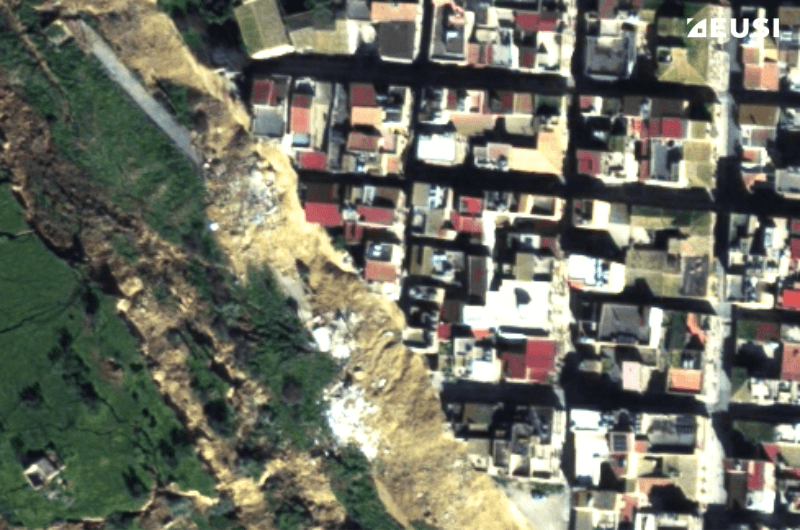
- Some buildings appear partially undermined, which suggests a risk of further collapse.
- Many tension cracks and minor scraps imply that the area is unstable.
Possibly undermined buildings suggest a high risk of further collapse. Satellite imagery © 2026 Vantor Provided by European Space Imaging
Satellite images as a tool for landslide management
VHR satellite imagery is used throughout the whole cycle of disaster management: prediction, prevention, planning, first response, resource allocation, evacuation, damage mapping, reconstruction monitoring… There are many reasons why it’s so valuable:
- Satellites can access all areas – they have no problem with mountains, blocked roads, or danger to personnel.
- Very High Resolution (30–60 cm) imagery provides enough detail, while also providing an overview of a large area around the landslide at the same time.
- With EUSI, the delivery of satellite images can be very fast – up to 15 min after collection – which means responders are working with fresh, real-time data.
- Multispectral satellite images reveal details invisible to the human eye, such as vegetation stress or soil moisture.
Do you want to learn more? Read about creating landslide hazard maps in the Bavarian Alps, about revealing water reservoir damage after landslides occurred in Saxony, or about using satellite images for emergency management in general.
Related Stories

Earth Observation Turns Ecological Targets into Measurable Outcomes: How Satellite Imagery Supports Compliance with Europe’s Nature Restoration Regulation
The EU’s Nature Restoration Regulation (NRR) entered into force in 2024 and set legally binding targets to restore degraded ecosystems across Europe. With National Restoration Plans due in September 2026, Member States face an urgent question: how do you map, plan and monitor restoration across millions of hectares in a consistent, verifiable way? Earth Observation (EO) – and Very High Resolution (VHR) multispectral satellite imagery in particular – is increasingly the answer.

EUSI Upgrades German Ground Segment to Enable Europe’s Fastest Request-to-Receive Satellite Intelligence via Secure Web and API Platform for Defence and Emergency Agencies
European Space Imaging (EUSI) announced a major upgrade of its satellite ground segment and cloud infrastructure, further accelerating its industry-leading satellite tasking and intelligence delivery capabilities through the secure ATOM™ web and API platform. The platform, in combination with EUSI’s Rapid Satellite Intelligence (RSINT) program, enables satellite tasking up to 30 minutes before image acquisition and delivery of imagery within 15 minutes of collection.

Maritime Domain Awareness in European Arctic Regions With VHR Satellite Intelligence
With the Arctic warming nearly four times faster than the average, the ice in the High North is melting and the sea is becoming increasingly navigable. In 2025 alone, 1812 vessels entered the Arctic Polar Code area, which is a 40% increase since 2013 when data collection began. While this rise in traffic presents potential commercial opportunities, more vessels also mean more risks to people and resources.

Seeing More in a Single Day: The Value of Intraday Satellite Collections
Imagine a convoy moves between 08:00 and 11:00. Or morning clouds clear by 14:00, revealing new activity. Or a structure appears at 09:30 that wasn’t visible at 07:00. If you’re working with once-daily satellite passes, you miss all of this. With intraday collections, you see it happen.