
Earth Observation Turns Ecological Targets into Measurable Outcomes: How Satellite Imagery Supports Compliance with Europe’s Nature Restoration Regulation
- Zuzana Hajkova, Content Marketing Coordinator, EUSI
The EU’s Nature Restoration Regulation (NRR) entered into force in 2024 and set legally binding targets to restore degraded ecosystems across Europe. With National Restoration Plans due in September 2026, Member States face an urgent question: how do you map, plan and monitor restoration across millions of hectares in a consistent, verifiable way? Earth Observation (EO) – and Very High Resolution (VHR) multispectral satellite imagery in particular – is increasingly the answer.
A Regulation Built on Data
With 80% of European habitats in poor condition1, the NRR aims to increase biodiversity, limit climate change, and reduce the impact of natural disasters. It introduces clear restoration targets, but it also demands something equally challenging: verifiable proof of progress.
Each EU Member State must prepare a National Restoration Plan, describing where restoration will take place, how much area is involved, and how results will be measured. These plans are expected to include maps, indicators and timelines. The September 2026 deadline is approaching rapidly, and yet many ecosystems remain incompletely mapped and their ecological condition is poorly understood.
For many applications, medium-resolution satellite data from programmes such as Copernicus Sentinel-2 (10–60 m resolution) provides a valuable baseline. However, the NRR often requires finer spatial detail: small and fragmented habitats, individual trees, narrow riparian corridors, or subtle changes in vegetation condition that simply can’t be resolved at 10 m. Very High Resolution (VHR) multispectral imagery, at 30 cm resolution, bridges that gap and provides the spatial and spectral precision that legally binding reporting demands.
From Baseline to Reporting: A Four-Step Process
The NRR follows a logical sequence: understand the current situation, plan interventions, implement on the ground, and monitor results. At each stage, consistent and comparable data is essential.
1. Building the Knowledge Base
Before restoration can begin, Member States must identify their ecosystems – how many, where, and in what condition there are. A lot of the data can be gained from satellite imagery. For example, 30 cm images with 8 spectral bands (in Europe provided by EUSI) can reveal vegetation health, soil moisture, water quality or carbon leaks. Archive imagery adds a further dimension: it allows authorities to see how ecosystems have changed over time, which is essential when restoration requires re-establishing habitats that have been lost rather than simply improving those that remain.
2. Designing National Restoration Plans
Once a baseline is established, countries must decide where to act. National Restoration Plans must identify priority areas, describe measures and set timelines, all while balancing ecological, economic and social considerations. At this stage, spatial information becomes a decision-support tool. EO data allows authorities to compare candidate sites, identify constraints – such as land use conflicts or infrastructure proximity – and plan across regional boundaries.
3. Implementation on the Ground
Restoration takes many forms: reconnecting rivers, restoring wetlands, or introducing green infrastructure into urban areas. These actions are site-specific and often require detailed information that broad-scale mapping can’t provide.
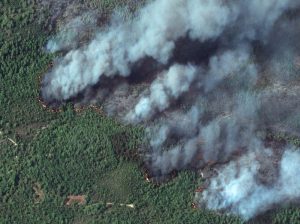
VHR satellite images reveal features that matter at the field level: the precise location of river barriers, the extent of invasive species encroachment, or the condition of individual trees. Frequent revisits highlight changes as they occur, which is particularly valuable when conditions shift rapidly, for example during a wildfire or pest outbreak.
4. Monitoring and Reporting
The NRR places strong emphasis on long-term monitoring. Member States must report regularly, beginning in 2028 and continuing over the following decades. This creates a need for data that is not only accurate but also consistent over time.
Different Ecosystems, Different Questions
The regulation covers a wide range of ecosystem types, each presenting distinct monitoring challenges. The role of EO varies accordingly.
Terrestrial, Coastal and Freshwater Ecosystems
EU Member States must ensure that at least 30% of degraded terrestrial, coastal and freshwater areas are under effective restoration by 2030, raising to 90% by 2050. This turns into a very practical challenge: How do you measure restoration across these vast, diverse and often fragmented landscapes?
Satellite data makes it possible to monitor vegetation dynamics, water regimes, and ecosystem condition at national scale. However, many habitats covered by the regulation are small and heterogenous. Wetlands, riparian corridors, coastal margins and fragmented grasslands may be too fine-scale to map accurately with 10–30 m sensors. VHR imagery at 30–50 cm resolves these features with sufficient precision for both initial mapping and repeatable change detection, needed to support NRR’s requirements for identifying degraded areas, prioritising restoration sites, and documenting re-establishment.2
Vegetation changes in High Weald National Landscape, UK. Satellite imagery © 2026 Vantor provided by European Space Imaging (EUSI)
Forest Ecosystems
For forest ecosystems, the NRR shifts the focus from simply restoring areas to improving ecological quality and resilience. Member States are required to demonstrate that forests are becoming more structurally diverse, better connected and storing more organic carbon, with measurable increases in deadwood as an indicator of ecological quality. These requirements make monitoring very complex: Authorities need to analyse not only where forests are but also how they function and evolve over time.
EO provides a scalable way forward. In Bulgaria, for example, remote sensing has been used to monitor bark beetle outbreaks in spruce forests, combining EUSI multispectral satellite imagery with vegetation indices such as NDVI to assess tree vitality and detect infestation patterns across large, mountainous areas. This approach made it possible to identify stressed and damaged forest stands, track the spread of infestations over time, and quantify changes in affected areas – revealing a significant increase in bark beetle damage within the study site.3 Across the EU, such approaches are expected to underpin national reporting on forest ecosystem condition under the NRR.
Agricultural Ecosystems
In agricultural areas, the NRR focuses on soil quality and landscape diversity. Member States must demonstrate improvement in at least two out of three indicators: grassland butterfly index, organic carbon in cropland mineral soils, and the share of agricultural land with high-diversity landscape features. Targets for farmland birds and drained peatlands add further complexity.
Satellite data supports multiple aspects of this monitoring challenge: mapping field boundaries and landscape features, or tracking seasonal vegetation patterns relevant to farmland biodiversity. Multispectral images with bands in the red, red edge, and infrared spectrum are used for crop species differentiation or plant health analysis.
The Red Edge Band in Agriculture
The red edge region of the electromagnetic spectrum, situated between the red and near-infrared (NIR) wavelengths (~680–750 nm), is a powerful diagnostic zone for vegetation analysis. This spectral region marks a rapid and steep change in reflectance, known as the red edge inflection point, and is caused by the transition from strong chlorophyll absorption in the red band to high reflectance in the NIR due to internal leaf structure. The exact location and slope of this inflection point are closely tied to chlorophyll content, plant health, and nitrogen levels. A red edge band is missing in nearly all 4-band imagery datasets.
Chart source: Datarock Spectral Library Viewer (Thomas Ostersen)
NDVI vs NDRE
While NDVI remains one of the most widely used vegetation indices, it is often less sensitive in areas with dense or healthy vegetation. NDRE (Normalized Difference Red Edge) addresses this limitation by incorporating a red edge band in place of the traditional red band, offering improved sensitivity to chlorophyll content and subtle changes in plant health. As a complementary index, NDRE enables more nuanced monitoring across the growing season through:
- Better Chlorophyll Sensitivity in Dense and Late-Stage Crops: More accurate in mature crops; avoids NDVI saturation in dense vegetation.4
- Superior Penetration Through Canopy Layers: Detects lower-layer stress missed by NDVI due to deeper red-edge penetration.5
- Enhanced Precision for Nutrient Management and Stress Diagnosis: Correlates strongly with nitrogen and stress, is ideal for precision agriculture.6
- Improved Crop Classification and Phenological Monitoring: Combining NDRE and NDVI improves crop type accuracy and seasonal analysis.7
NDRE vs NDVI Comparison: The NDRE image (top left) reveals greater detail in medium and stressed crop zones, highlighting early signs of nutrient deficiency or water stress that the NDVI image (bottom right) masks with uniformly high values, underscoring NDRE’s superior sensitivity in dense, late-stage canopies. Satellite imagery © 2026 Vantor provided by European Space Imaging (EUSI)
Urban Ecosystems
A study of 862 European cities found that fewer than 15% of urban residents live in accordance with the 3-30-300 rule, a principle which recommends three trees visible from every home, 30% canopy cover in every neighbourhood, and a high-quality green space within 300 metres8. The NRR responds to this gap by requiring Member States to stop the net loss of urban green space and tree canopy cover by 2030, and to increase them afterwards.
How does EO help with this? At EUSI’s 30 cm native resolution, which can be processed to 15 cm HD, authorities can use Arboair AI to extract a detailed analysis of individual trees including information about tree species, health, or size. Unlike UAV sensors or aerial collections, satellite imagery strips are kilometres wide and can cover an entire city within a few passes. Satellite-based analysis of urban trees has been shown to reduce the cost of building a tree inventory to €5 and 3 minutes of processing time per tree, compared to €15 and 15 minutes with traditional field surveys.
Comparison of image sizes from different sensors.
Case study: Urban Tree Species Mapping & Enhanced LULUC Analysis with Expanded Spectral Bands
Urban biodiversity monitoring increasingly depends on the ability to distinguish tree species in complex built environments. High spectral resolution plays a vital role in capturing subtle biochemical and structural variations. This case study shows how the combined use of NIR-1, NIR-2, and red-edge bands from WorldView-2 can enhance tree species mapping and urban land-cover understanding.
Challenge: In Johannesburg, mapping non-native (“alien”) urban tree species was challenging due to mixed vegetation, built features, and spectral similarity among tree canopies. Traditional high-resolution imagery lacked the spectral depth needed to discriminate species based on foliage composition and internal leaf structure.
Solution: By leveraging WorldView-2’s eight-band dataset, including the dual NIR and red-edge channels, researchers applied object-based image analysis to classify urban tree species. The extra bands, especially NIR-2 and the red edge, captured subtle reflectance differences tied to leaf water content and internal morphology, improving species separability.
Results: This improved classification outperformed what could be achieved using standard VNIR (4-band) multispectral data alone. The study demonstrates that incorporating NIR-1, NIR-2, and red-edge information in urban spectral datasets enables more accurate tree species identification, bolstering urban LULC mapping and biodiversity inventory efforts. This spectral depth is especially valuable for planners and ecologists who require precise, scalable tools for urban ecosystem management.9
Resulting map showing the five urban tree species and LULC classes in the Randburg municipal area
Connectivity of Rivers and Natural Functions of Floodplains
Member States are required to create a complete inventory of artificial barriers to river connectivity, identify which should be removed, and contribute to the final goal of restoring 25,000 km of rivers in the EU into free-flowing rivers by 2030. To make the decision on which barriers should be removed, authorities need to know which ones are needed for flood protection and other uses – an answer which can be partly provided by EO.
Satellite data supports detection and mapping of barriers such as weirs and dams, terrain analysis for flood modelling, and pre- and post-intervention monitoring of river morphology and floodplain vegetation. These insights help determine where interventions will have the greatest effect, and time series analysis document how river systems respond after the barrier removal.
Satellite imagery also plays an important role in flood risk management and predictions. You can use multispectral images to conduct soil analysis, which reveals valuable information about soil moisture, soil texture, and other soil properties that influence water infiltration and runoff. 3D models created from satellite imagery can be used to analyse the terrain and assess which areas are at risk of flooding.
Additionally, band ratios involving the yellow band, such as Yellow/NIR2, show strong correlation with measured water depths, supporting effective bathymetric modelling and monitoring of shallow water bodies.
Time series of Bacino di San Giacomo, Italy. Satellite imagery © 2026 Vantor provided by European Space Imaging (EUSI)
Case study: Unlocking Bathymetric Precision with Yellow & NIR-2 Spectral Bands in the Sarca River
Challenge: The Sarca River in northeastern Italy presents a typical challenge for shallow-water bathymetry: variable substrates, mixed sediment sizes, and fluctuating water clarity. Conventional high-resolution imagery with only four bands (RGB + NIR) struggles to discriminate subtle spectral differences in shallow, heterogeneous river systems, limiting depth accuracy and consistency.
Method: Researchers used Optimal Band Ratio Analysis (OBRA) on WorldView-3 imagery, comparing results to a 4-band GeoEye-1 dataset. WorldView-3 offers eight multispectral bands in the VNIR range, including Yellow and NIR-2, which are absent from GeoEye-1. The Yellow band captures finer sediment-water contrast in the visible spectrum, while NIR-2 penetrates shallow water more effectively than a single NIR band, providing a stable denominator for depth calculation.
Results: Yellow/NIR-2 ratios from the WorldView-3 data improved correlation with measured depths, achieving R² values around 67% and reducing error from 6 cm RMSE (4-band) to 4 cm RMSE. The extra bands delivered about 10% higher accuracy, showing that expanded spectral coverage can significantly boost bathymetric precision without changing spatial resolution.10
Image source: Niroumand-Jadidi, M., & Vitti, A. (2016). Optimal Band Ratio Analysis of WorldView-3 Imagery for Bathymetry of Shallow Rivers (Case Study: Sarca River, Italy). ISPRS Archives, 41(B8), 361–368. https://www.researchgate.net/publication/304343285_OPTIMAL_BAND_RATIO_ANALYSIS_OF_WORLDVIEW-3_IMAGERY_FOR_BATHYMETRY_OF_SHALLOW_RIVERS_CASE_STUDY_SARCA_RIVER_ITALY
Marine Ecosystems
The NRR targets specific marine habitats, such as seagrass meadows, macroalgal forests, or sedimentary beds. Satellite imagery is relevant, but more selectively than on land. Its effectiveness depends strongly on water depth, clarity, and habitat type. In coastal and shallow marine environments, multispectral data is highly valuable: It can map and monitor seagrass extent, macroalgae, sediment plumes, and coastal water quality, all of which are directly linked to ecosystem condition and restoration success.
Turning Observations into Information
Satellite data on its own is not a monitoring system. Its value lies in how it is processed, interpreted and integrated with other data sources. The NRR requires indicators that are comparable across Member States and consistent across reporting periods – requirements that place significant demands on the analytical frameworks built around EO data.
In most applications, satellite imagery needs to be combined with field observations, habitat classifications and ancillary spatial data to produce the indicators that policy requires. The quality and resolution of the underlying imagery determine what is detectable and what is not: whether a small wetland is mappable, whether a hedgerow can be distinguished from a field boundary, or whether a gradual shift in vegetation condition constitutes a measurable change.
Where VHR 8-band data is available, the precision of these outputs increases significantly. Classification accuracy improves, smaller features become mappable, and the uncertainty associated with change detection decreases. For a regulation whose targets are legally binding and subject to international scrutiny, this increase in data quality translates directly into more defensible reporting.
A Shift of EO Towards Continuous Monitoring
The NRR introduces a long-term monitoring obligation that is different from the occasional mapping projects that have characterised much environmental assessment to date. Consistent time series, regular updates and national-scale datasets will become standard requirements.
This shift is likely to reshape how EO services are used. Rather than one-off mapping campaigns, public authorities will need long-term access to updated imagery and derived products. The integration of different data sources – VHR commercial imagery, medium-resolution public data from Copernicus, field survey results and in-situ sensors – will become routine. And the geospatial sector is well placed to support this transition.
Conclusion
The Nature Restoration Regulation sets clear ecosystem recovery targets that require Member States to know where to restore, how to prioritise investment, and how to demonstrate results over time. The success of meeting these targets depends on access to accurate, consistent and spatially detailed information. Earth Observation provides a highly efficient way to monitor change at scale; however, many of the features that matter most for restoration require a fine level of detail that only Very High Resolution satellite imagery can deliver. Providers like European Space Imaging (EUSI), offering access to 30 cm 8-band multispectral imagery and long-term data continuity, are helping to bridge the gap between policy requirements and operational monitoring, supporting Member States in turning restoration targets into verifiable outcomes.
References
1. European Commission. Nature Restoration Regulation. (n.d.). Available at:https://environment.ec.europa.eu/topics/nature-and-biodiversity/nature-restoration-regulation_en
2. European Parliament and Council of the European Union. (2024). Regulation (EU) 2024/1991of 24 June 2024 on nature restoration and amending Regulation (EU) 2022/869. Available at:
https://eur-lex.europa.eu/legal-content/EN/TXT/HTML/?uri=CELEX%3A32024R1991
3. European Space Imaging. (2022, March 31). Detecting bark beetle damage in Bulgaria. Available at:
https://www.euspaceimaging.com/blog/2022/03/31/detecting-bark-beetle-damage-in-bulgaria/
4. Evaluation of rededge basedvegetation indices for crop yield estimation: introduction of the triple red edge index (TREI). International Journal of Applied Earth Observation and Geoinformation. https://doi.org/10.1016/j.jag.2024.103012
5. Buczkowski, A. (2022, October15). Beyond NDVI: What are vegetation indices, and how are they used in precision farming?Geoawesome. Available at: https://geoawesome.com/eo-hub/beyond-ndvi-what-are-vegetation-indices-and-how-are-they-used-in-precision-farming/
6. EOSDA. (2025, March 3). NDRE: Normalized Difference Red Edge Index. EOSDA. Retrieved fromhttps://eos.com/make-an-analysis/ndre/
7. Kang, Y., Hu, X., Meng, Q., Zou, Y., Zhang, L., Liu, M., & Zhao, M. (2021). Land Cover and Crop Classification Based on Red Edge Indices Features of GF 6 WFV Time Series Data. Remote Sensing,13(22), 4522. Available at:https://www.mdpi.com/2072-4292/13/22/4522
8. Joint Research Centre. (2026, April13). Urban green spaces are scarce, while climate and wealth impact access. Available at:
9. van Wyk, E., Kahle, H., &Mathabe, T. (2020). The influence of expanded spectral bands on mapping invasive tree species in urban areas using WorldView-2. Cogent Environmental Science, 6(1), Article1754146. Available at: https://www.tandfonline.com/doi/full/10.1080/23311886.2020.1754146
10. 1Niroumand-Jadidi, M., & Vitti, A. (2016). Optimal Band Ratio Analysis of WorldView-3 Imagery for Bathymetry of Shallow Rivers (Case Study:Sarca River, Italy). ISPRS Archives, 41(B8), 361–368. https://www.researchgate.net/publication/304343285_OPTIMAL_BAND_RATIO_ANALYSIS_OF_WORLDVIEW-3_IMAGERY_FOR_BATHYMETRY_OF_SHALLOW_RIVERS_CASE_STUDY_SARCA_RIVER_ITALY
Related Stories

EUSI Upgrades German Ground Segment to Enable Europe’s Fastest Request-to-Receive Satellite Intelligence via Secure Web and API Platform for Defence and Emergency Agencies
European Space Imaging (EUSI) announced a major upgrade of its satellite ground segment and cloud infrastructure, further accelerating its industry-leading satellite tasking and intelligence delivery capabilities through the secure ATOM™ web and API platform. The platform, in combination with EUSI’s Rapid Satellite Intelligence (RSINT) program, enables satellite tasking up to 30 minutes before image acquisition and delivery of imagery within 15 minutes of collection.

Maritime Domain Awareness in European Arctic Regions With VHR Satellite Intelligence
With the Arctic warming nearly four times faster than the average, the ice in the High North is melting and the sea is becoming increasingly navigable. In 2025 alone, 1812 vessels entered the Arctic Polar Code area, which is a 40% increase since 2013 when data collection began. While this rise in traffic presents potential commercial opportunities, more vessels also mean more risks to people and resources.

Seeing More in a Single Day: The Value of Intraday Satellite Collections
Imagine a convoy moves between 08:00 and 11:00. Or morning clouds clear by 14:00, revealing new activity. Or a structure appears at 09:30 that wasn’t visible at 07:00. If you’re working with once-daily satellite passes, you miss all of this. With intraday collections, you see it happen.

GEOSeries: Maintaining Temporal Control of Developing Situations With Rapid Satellite Tasking and Intraday Imaging
In the fast-moving operational environments of security monitoring and emergency response, the value of satellite data is defined by when it arrives, not just its resolution or accuracy. This webinar explores how Dynamic Tasking enables users to access actionable data fast and operate within mission decision windows.