


GEOSeries: Extracting Insights From High Resolution SAR Imagery for Time-Sensitive Analysis
In this webinar, industry experts and advanced users of Umbra SAR data showcase how they transform SAR imagery into actionable insights in real-world mapping, monitoring and intelligence applications. See how NV5 and Umbra leverage ENVI SAR Essentials for advanced processing with time-efficient results, converting analytics into valuable intelligence.
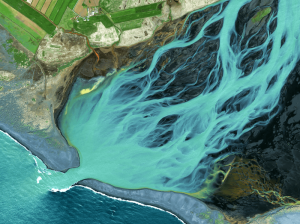
Using Satellite Imagery to Build Water Resilience Across Europe
Water across Europe is facing severe pressure. Climate change, urbanisation, agricultural demands and other sources of pollution are threatening water security and creating critical challenges that need to be addressed. We have to act quickly, build stronger systems and create sustainable water resilience practices – so that both natural ecosystems and human communities can thrive. Here is how satellite imagery from EUSI can help.

EUSI and Albedo Partner to Deliver 10 cm Resolution Satellite Imagery to Europe
It is our pleasure to announce the partnership with Albedo, a builder of high-performance spacecraft and the first satellite designed to operate commercially in VLEO (Very Low Earth Orbit). This partnership will bring the world’s highest resolution satellite imagery to the European and North African market.

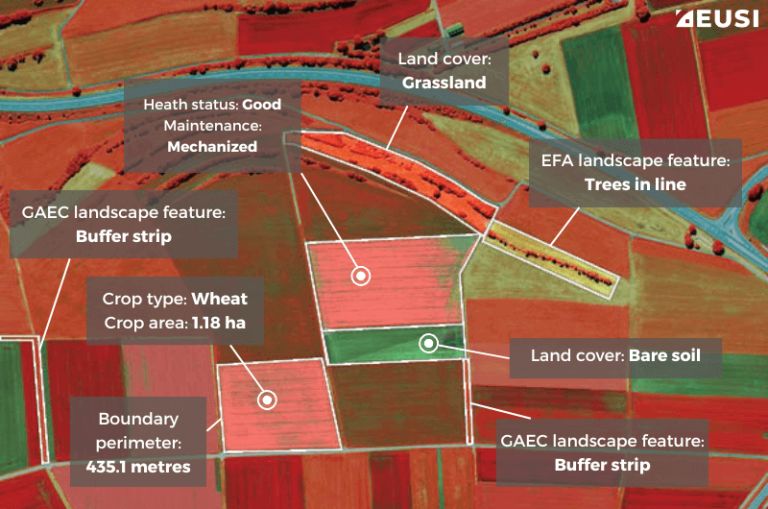
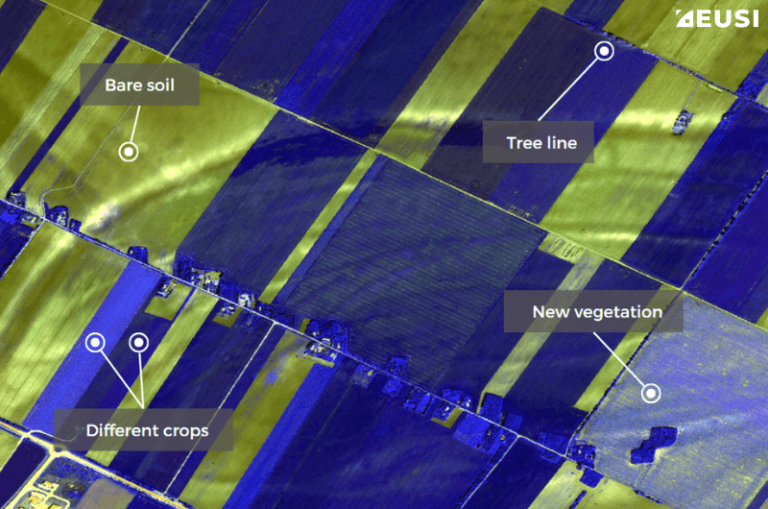
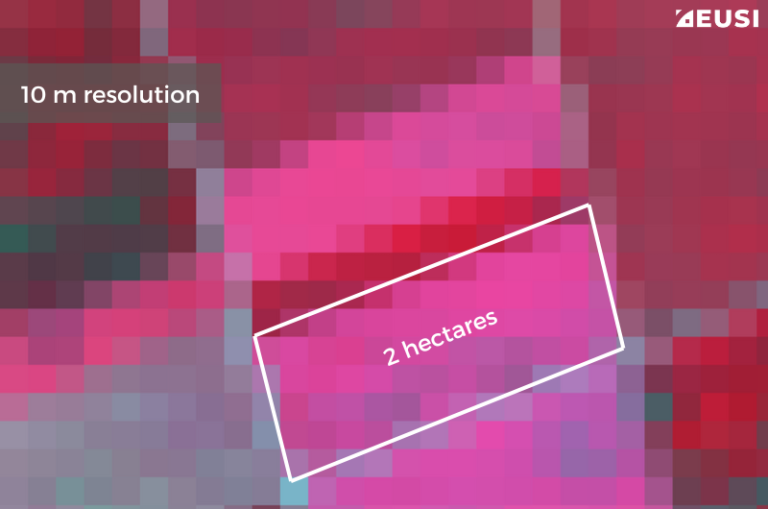
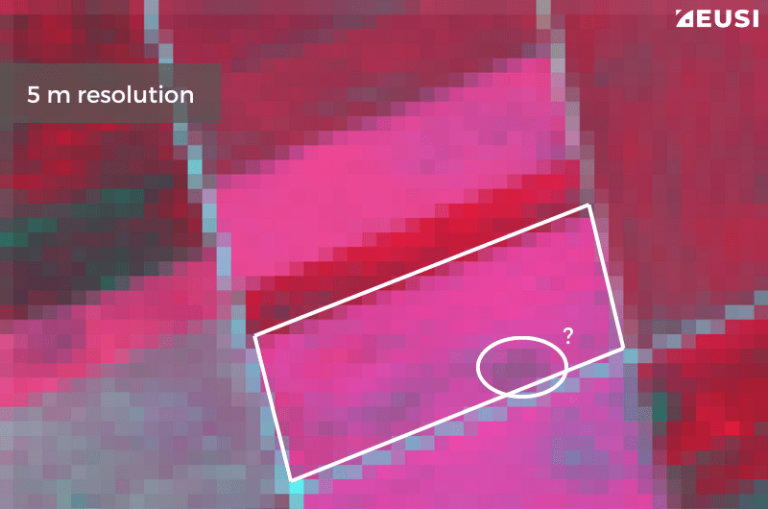
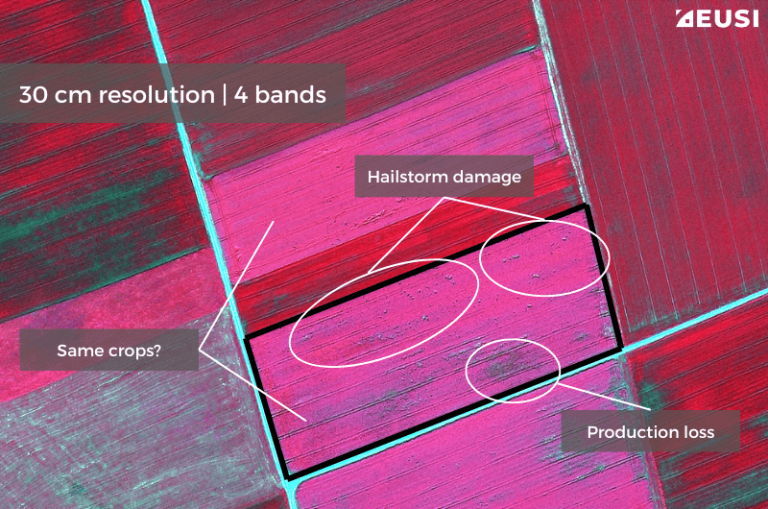
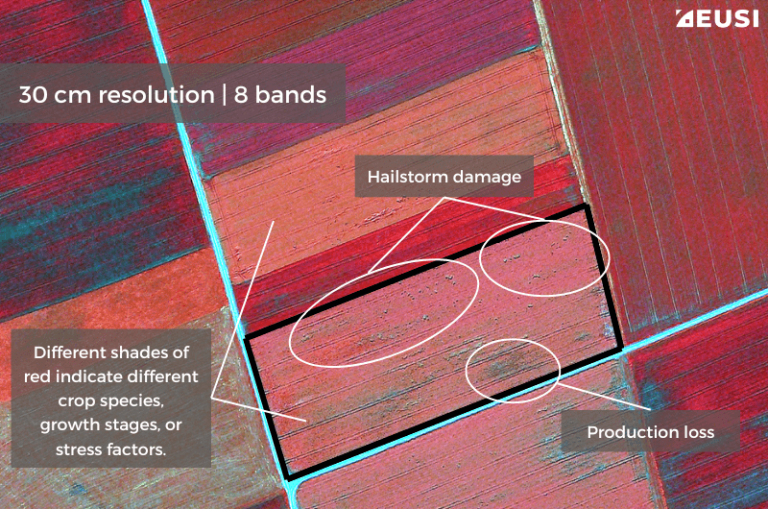
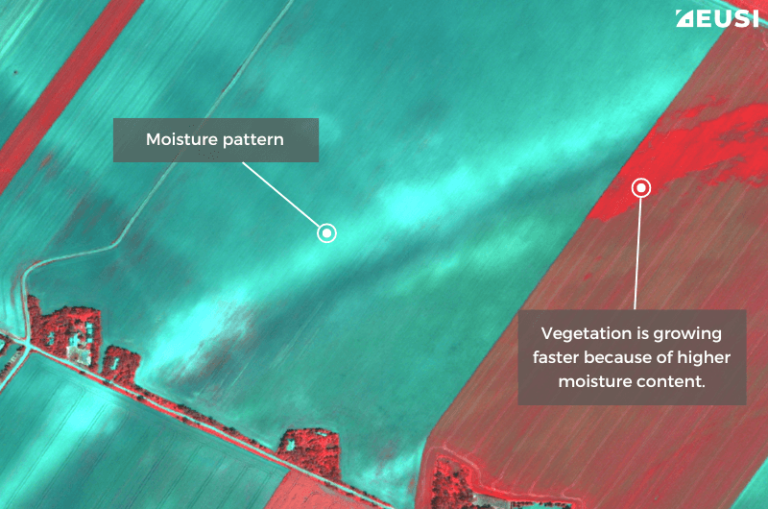
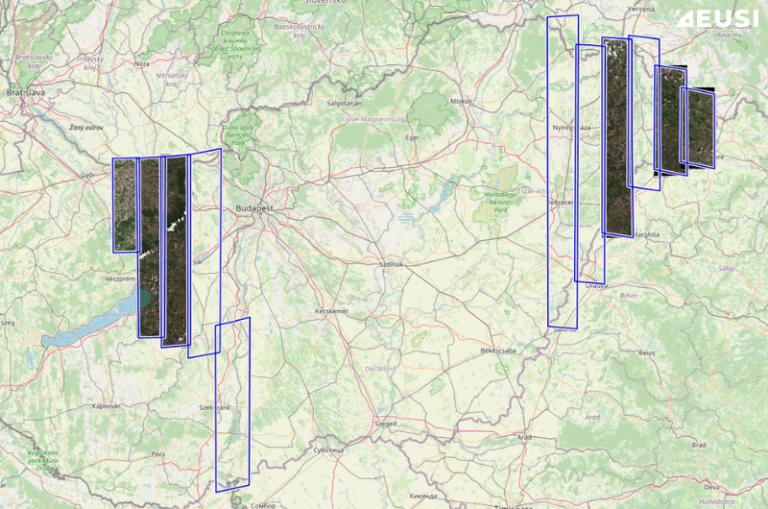
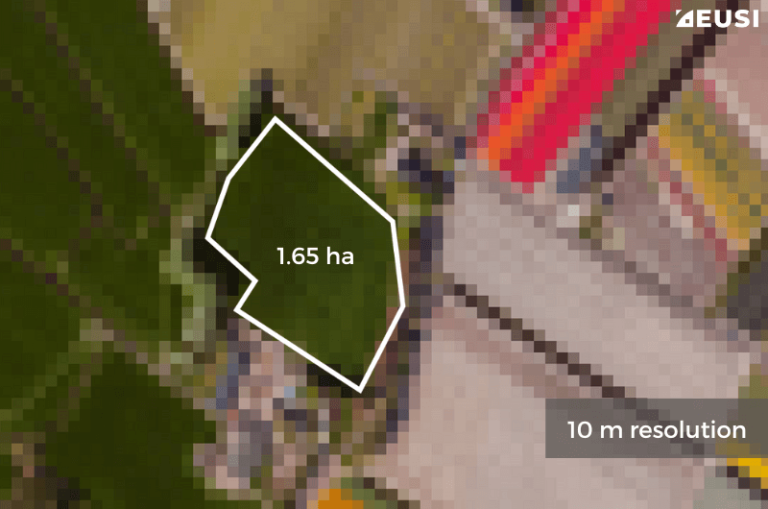
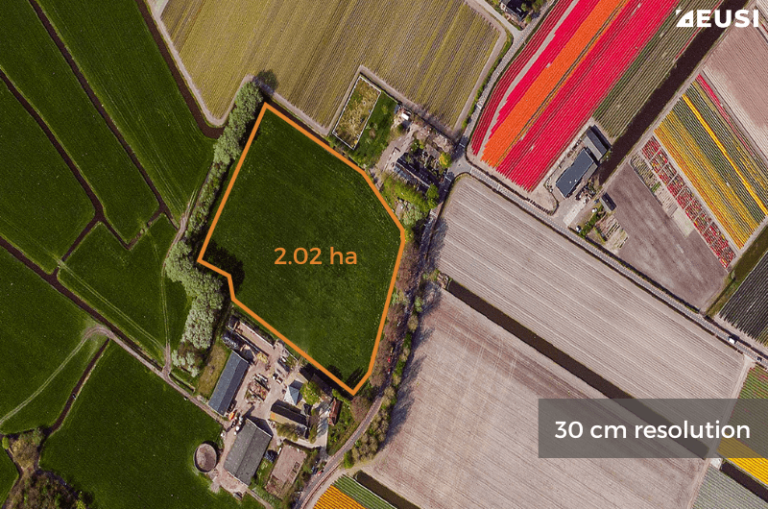
Updating the Land Parcel Identification Systems in 2025: The Benefits of Using Satellite Images
Agricultural paying agencies across Europe face increasing challenges in maintaining accurate and up-to-date Land Parcel Identification Systems (LPIS), ensuring compliance with the Common Agricultural Policy (CAP) and supporting sustainable agricultural practices.