What is SAR Imagery? Introduction to Synthetic Aperture Radar
SAR imagery enables all-weather monitoring, penetrates dry soil, and offers resolution as high as 25 cm. Thanks to that, it’s invaluable for applications like emergency response, defence and intelligence, or agriculture. How does SAR work? What are its advantages and limitations? And what other data sources can you integrate it with? Read the article to learn more.
Enhancing Critical Applications With A Combined Optical and SAR Approach
For the first time in history, users can schedule synchronised collections of 25 cm SAR and 30 cm Near Real-Time optical imagery to mitigate weather and gain deeper insights of events unfolding on the ground. This is especially valuable for Emergency Response, GEOINT and other applications.
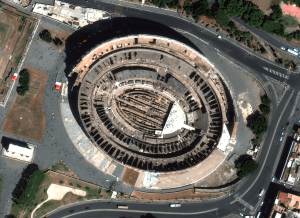
18 European Landmarks in Satellite Images
Satellite sensors captured unique architecture, breathtaking nature and centuries of history. Explore the Colloseum, La Sagrada Familia, the Leaning Tower of Pisa, and other landmarks.

Understanding ONA in Satellite Imagery: What is Off Nadir Angle and What Is It Used For?
Off Nadir Angle (ONA) plays a crucial role in the quality of optical satellite imagery. It influences its resolution and clarity, decides the visibility of features, and makes it easier or harder to identify objects. Moreover, ONA is used to create stereo imagery and 3D models of the Earth’s surface. Read on to learn more.